
for a full report
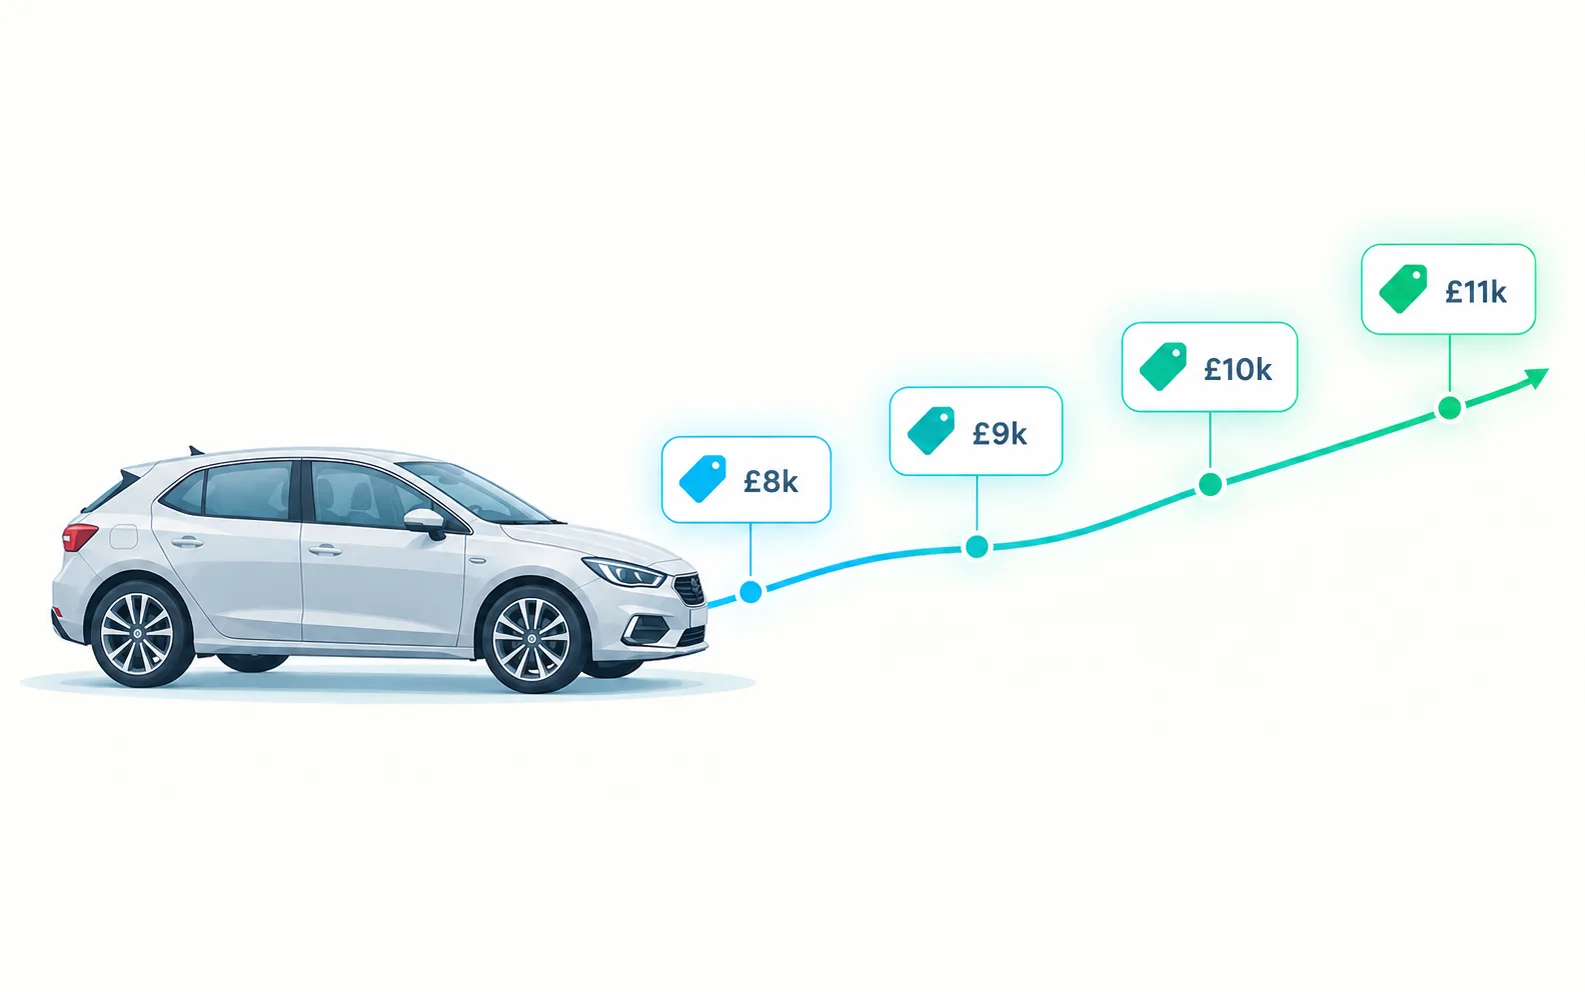
months of depreciation forecast
years - average UK car age
The four values
Most arguments about a car's worth are really arguments between two definitions. There are four, and they sit on a ladder.
Trade
the lowestWhat a dealer pays to put the car into stock. It has to leave room for preparation, warranty, advertising and forecourt time.
Part-exchange
close to tradeWhat a dealer offers against a car you’re buying from them. Sometimes flattered on paper, then recovered in the price of the car you’re buying.
Private
the middleOne private individual to another. Above trade, because no dealer takes a margin. Below retail, because there’s no warranty and no comeback.
Retail
the highestThe screen price on a forecourt. You’re paying for preparation, consumer rights, and the ability to walk away when it goes wrong.
On a typical used car, trade and retail sit £1,000 to £3,000 apart across the market, and the gap widens as the car gets more expensive.
Between those four sits the number that actually matters to you: the current market value - what the car is genuinely worth today, in the condition it's actually in. That's the figure a valuation should be solving for.
The most common mistake
What moves the price
Valuation isn't make, model and mileage. It's a weighted stack - and the weighting surprises people. These are the five that matter most:
Exact derivative and trim. Not “3 Series”, but which engine, which trim, which gearbox. Same badge, same year, thousands apart. There are 318 car brands on UK roads and vastly more derivatives beneath them, which is why a valuation built on the model name alone is guesswork. AnalyzeMyCar reads the build sheet - manufacturer technical specification, factory feature bundles, and the original pricing of each equipment package.
Mileage against expectation. The raw number matters less than the number for the car’s age. That’s why your report grades the vehicle on average miles per year rather than the odometer in isolation. A five-year-old car on 35,000 miles is unremarkable. The same car on 90,000 is a different asset entirely.
Service history. Full and documented is one of the strongest positives in the market. Patchy is one of the strongest negatives. The Digital Service Book pulls dated service records, authorised dealer visits, component replacements and whether maintenance intervals were actually honoured - so history quality becomes a measurement, not a seller’s claim.
Condition. Paint, panels, wheels, interior, tyres. This is where most of the variance between “identical” cars lives. The Visual Assessment puts a number on it: part-by-part repair cost estimates in GBP, plus labour hours, from the images you upload - then that cost is taken off the market value to give the final figure.
Provenance. A gap in the service history. An import. A mileage discrepancy. Any single one of these can reset the valuation permanently - and none of them are visible on the car.
The ones that nudge it
- Previous owners - a tiebreaker, not a driver.
- Colour - safe metallics hold value; bold shades narrow the buyer pool.
- Options - a £3,000 factory option might return a few hundred pounds at three years old - the build sheet shows what was actually fitted and what it originally cost.
- Transmission - automatic is now the default expectation in most segments.
- MOT remaining - a fresh 12 months is worth real money privately. It removes the buyer’s nearest unknown.
- Region and season - convertibles sell in March. Four-wheel drive sells in October.
Depreciation, in pounds
Depreciation is the largest running cost of most cars. It is also front-loaded.
A new car typically loses 15-25% in its first year, and lands roughly 45% down by year three - with the range across the market running from about 40% to 60%, depending on demand, reliability reputation and running costs. After year three the curve flattens sharply: the pound-per-year loss on a seven-year-old car is a fraction of a one-year-old's, even though the percentage swings look more dramatic.
Two things follow from that:
The three-year-old car is where the value is. Someone else absorbed the worst of the curve, and the car still has most of its life ahead of it.
Think in pounds, not percentages. 15% of £30,000 is £4,500. 15% of £6,000 is £900. Same percentage, five times the loss.
This is also why a valuation that only tells you today's number is half useful. Your report includes 12 and 24-month depreciation forecasts, so you can see what the car is likely to be worth when you come to sell it - not just what you're paying now.
The bottom line
Why identical cars differ
Same model. Same year. Same mileage. £2,500 apart. The explanation is almost always one of these six:
- Trim and options - the most common hidden cause, and the hardest to spot without the build sheet.
- History quality - a stamped, invoiced record versus three stamps and a gap.
- Wear items - four good tyres and healthy brakes, or tyres at the limit and kerbed wheels. That alone is over £1,000 of spend waiting for you.
- A marker one car carries - a mileage anomaly, an import, or a gap in the service record.
- MOT pattern - clean consistent passes versus years of the same repeat advisory. How to read an MOT history →
- Time on market - a car advertised for eleven weeks is priced wrong, and the seller already knows it.
Notice what those six have in common: not one is visible in a registration plate and a mileage figure. That's the whole problem with a postcode-and-mileage estimator. It can't see the service book, the panel gaps or the mileage story, so it prices the average car of that description.
The car in front of you is never the average one. Which is why a valuation needs the vehicle's actual record and actual condition attached to it - the difference between an average figure and one adjusted for this car's real condition, that knows it needs two tyres and a bumper respray and takes that off the number.
What the UK fleet shows
Zoom out from a single car and the shape of the national fleet explains a lot of current pricing. All of these come from our own CarParc data:
The used market is old, and getting older. The average UK car is 9.1 years old, and only 30% of the fleet is under five years old. Most transactions happen well past the steep part of the depreciation curve - where condition and history matter far more than age.
The biggest cohort is 2015-2019. 11.2M cars sit in that band, against 10.2M for 2020-2025 - a legacy of the collapse in registrations during the pandemic and semiconductor shortage. Thinner supply of three-to-six-year-old stock is part of why prices at that age have held up.
Electrification is splitting the market. Battery electric cars have grown +795% in five years to 1.74M, and among new registrations petrol is down to 29.5% while hybrid leads at 32.1% and battery electric takes 22.8%. Battery health now does to a used EV what a tired engine does to a petrol car - and brand trajectory matters too. Compare Volkswagen and Toyota: 3.05M cars on the road versus 1.83M, but electrified shares of 8.2% and 44.3%. Two very different residual stories.
Brand momentum moves residuals. Rising marques hold value better than shrinking ones, because demand follows presence. Cupra is up 52.4% and Polestar 49.1% year on year, while Vauxhall is down 4.3% and Citroën 3.9%.
Your car's number, not the average one
A valuation is only as good as what it knows about the specific car. AnalyzeMyCar builds it from the vehicle itself - official registration and MOT records, AutoDAP build and service data, and live market pricing - drawing on multiple data points, returned in under 10 seconds.
The Market Valuation Analysis in your report gives you:
Current market value estimate - a live market value for the exact car - adjusted for its mileage, specification and condition, not a make-and-model average.
Vehicle grading - scored on average miles per year, so usage is judged against the car’s age.
12 & 24-month depreciation forecasts - what it’s likely to be worth when you sell, not just what it’s worth today.
Purchase and package cost analysis - what you’re actually committing to.
Refurbishment cost analysis - the work the car needs, costed - and taken off the number.
Final valuation after refurbishment - the market value adjusted for this exact car’s condition. The figure that actually matters.
It sits alongside the full MOT history, the Digital Service Book, the build sheet and the AI Visual Assessment - so the valuation is informed by the car's real record and real condition rather than its description.
Extended Info + Valuation costs 2 credits. Credits run from £0.90 to £1.20 each depending on the pack, so a valuation-backed report is roughly £2. A Full Report - every section, including Visual Assessment - is 10 credits, or £10. Your first full report is free.